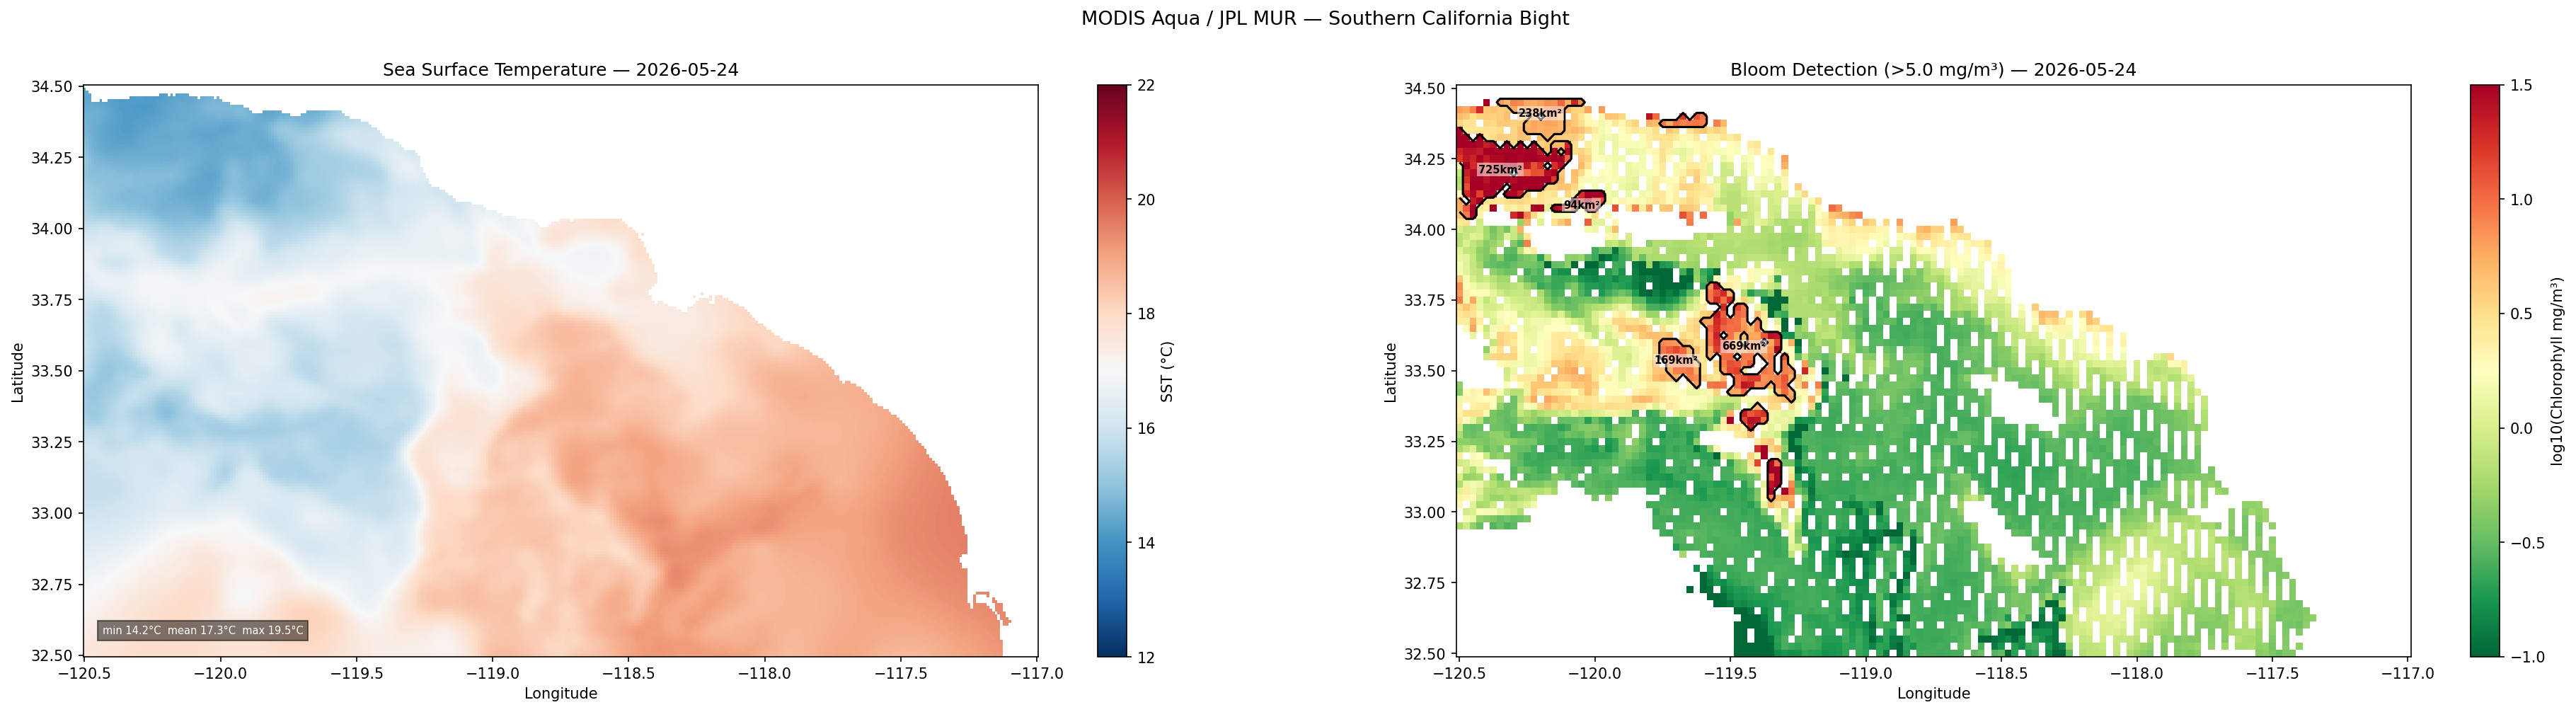
🛰 Chlorophyll Map & Bloom Detection
📈 Bloom Time Series (Last 30 Days)
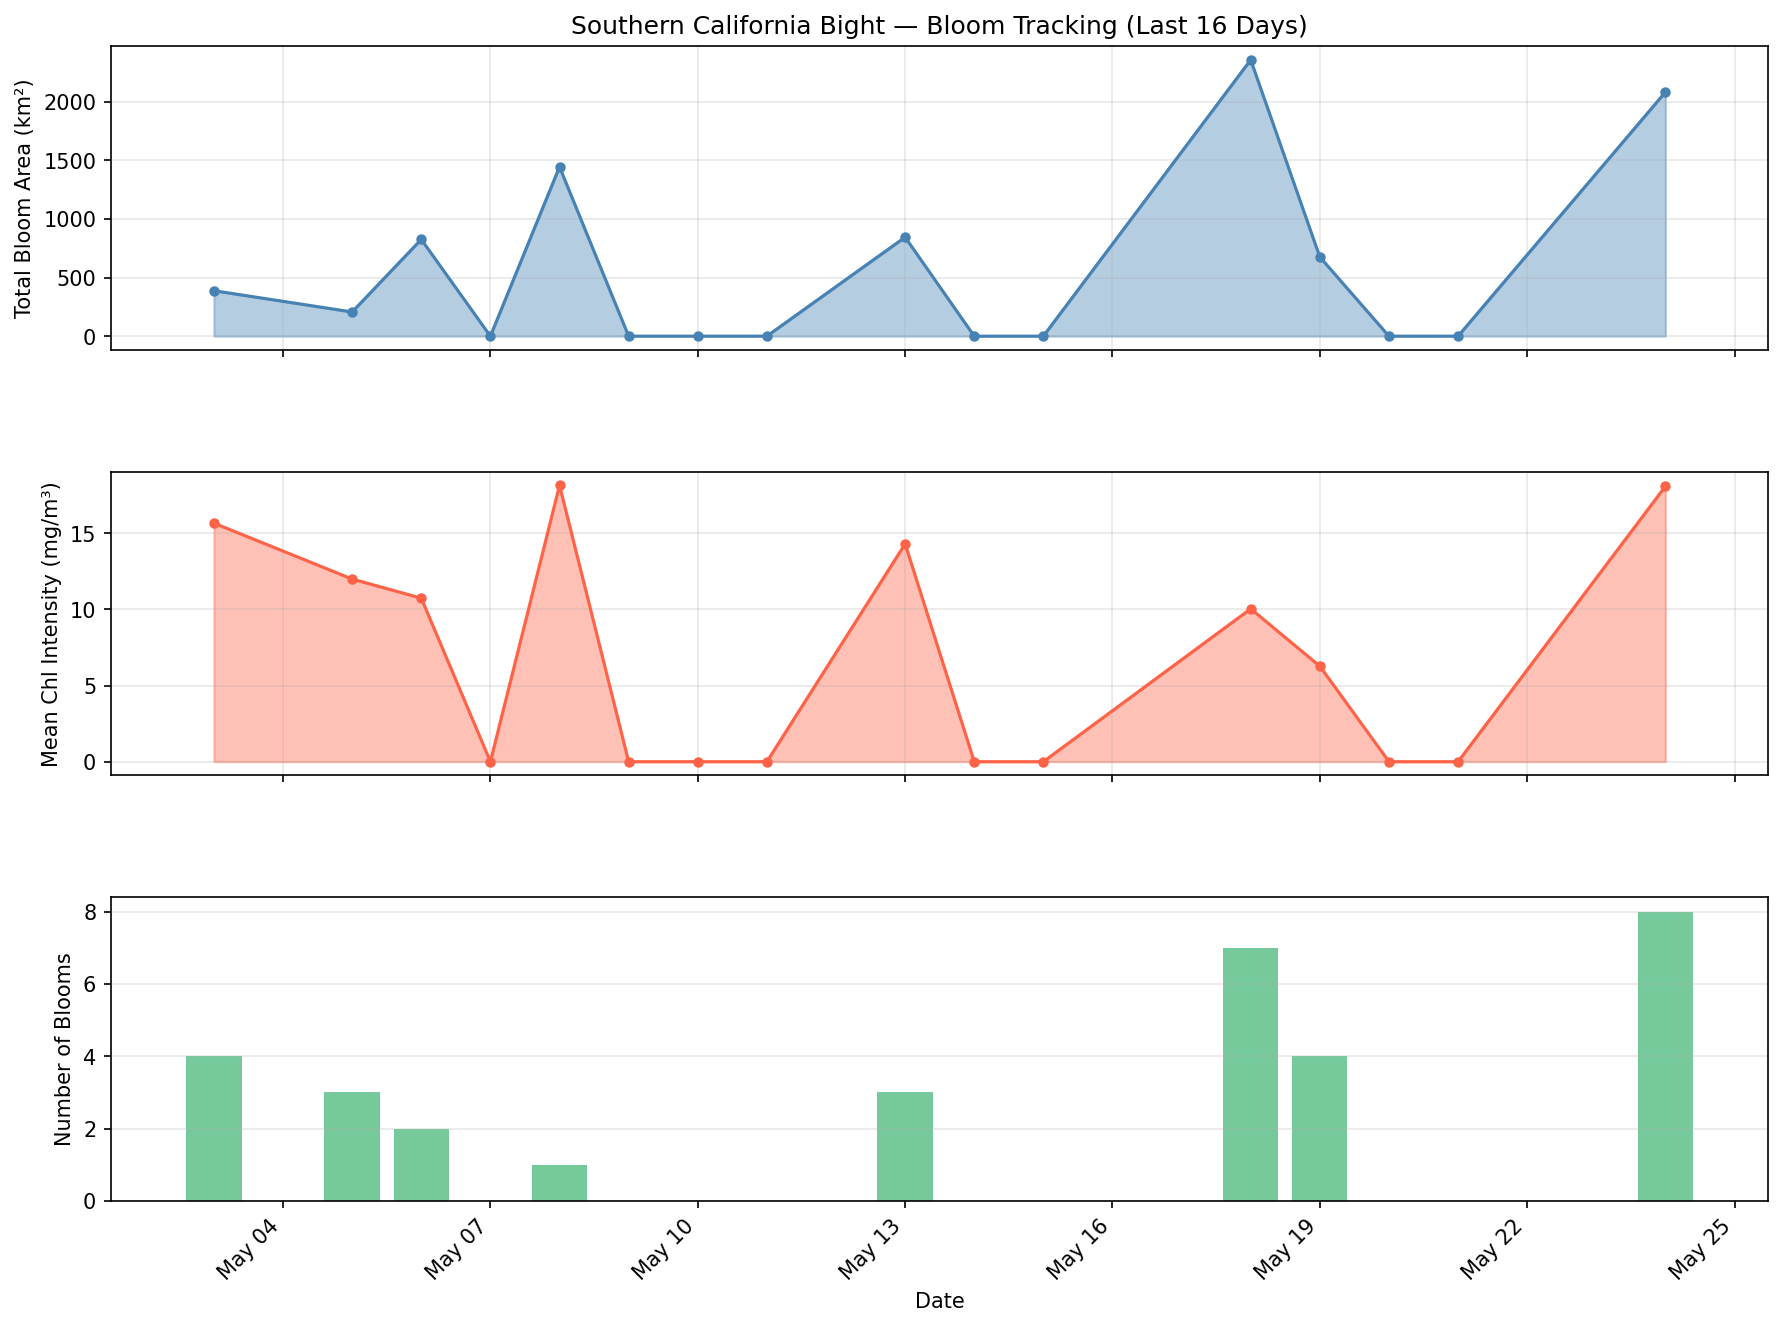
📋 Detection History
| Date | Blooms | Total Area (km²) | Mean Intensity (mg/m³) | Max Bloom Area (km²) | Max Chl (mg/m³) |
|---|---|---|---|---|---|
| 2026-05-24 | 8 | 2081.2 | 18.098 | 725.0 | 85.14 |
| 2026-05-21 | 0 | 0.0 | 0.000 | 0.0 | 0.00 |
| 2026-05-20 | 0 | 0.0 | 0.000 | 0.0 | 0.00 |
| 2026-05-19 | 4 | 675.0 | 6.272 | 300.0 | 9.51 |
| 2026-05-18 | 7 | 2356.2 | 10.043 | 1281.2 | 40.68 |
| 2026-05-15 | 0 | 0.0 | 0.000 | 0.0 | 0.00 |
| 2026-05-14 | 0 | 0.0 | 0.000 | 0.0 | 0.00 |
| 2026-05-13 | 3 | 843.8 | 14.307 | 500.0 | 40.20 |
| 2026-05-11 | 0 | 0.0 | 0.000 | 0.0 | 0.00 |
| 2026-05-10 | 0 | 0.0 | 0.000 | 0.0 | 0.00 |
| 2026-05-09 | 0 | 0.0 | 0.000 | 0.0 | 0.00 |
| 2026-05-08 | 1 | 1443.8 | 18.152 | 1443.8 | 70.11 |
| 2026-05-07 | 0 | 0.0 | 0.000 | 0.0 | 0.00 |
| 2026-05-06 | 2 | 825.0 | 10.742 | 712.5 | 85.07 |
| 2026-05-05 | 3 | 206.2 | 11.998 | 75.0 | 33.71 |
| 2026-05-03 | 4 | 387.5 | 15.671 | 118.8 | 37.79 |